© 2025 All rights reserved
News
Politics News
Politics News
Browse all Politics related articles and news. The latest news, analysis, and insights on Politics.
Daily Market Summary with JrKripto 10 April 2025
You can find our article “Daily Market with JrKripto” below, where we have compiled the most important developments in global and local markets. Let's analyze the general market conditions together and take a look at the latest assessments.Bitcoin (BTC) is currently trading at $81,800. The first resistance level in BTC, which gained an upward momentum with the reaction from the $75,930 support, has been approached to $82,819. If this level is exceeded, it may be possible for the price to rise to the levels of $ 85,419 and then $ 92,214. However, if there is a rejection below $82,819, a retreat towards the $75,930 support may be seen again. If this level is lost, the levels of $ 73,804 – $69,615 – $ 67,496 will be followed as the next supports.Ethereum (ETH) is trading at the level of $1,600. The fact that the price has risen above the $ 1,486 level again indicates that the selling pressure has decreased. If the resistance of $1,585 is exceeded during the continuation of the upward movement, the price can be expected to recover to the levels of $ 1,900 and $ 2,000. Daily closures above $2,000 could mark the beginning of a new uptrend for ETH towards the $2,277 and $2,428 levels. In the downside scenario, $1,486 will be followed as support again; if this level is broken, the levels of $1,370 and $1,217 may be raised.Crypto News21Shares has submitted the S-1 file for the Dogecoin ETF.President Trump has offered to meet and meet with Chinese President Xi Jinping Dec.Tether mints $1 billion USDTThe SEC has approved options for spot ETHEREUM ETFs.Pakistan plans to allocate some of its surplus electricity to #Bitcoin mining.VanEck said that China and Russia have conducted some commercial transactions using Bitcoin.Mastercard has partnered with Kraken to allow users in Europe to spend #Bitcoin at more than 150 million merchants worldwide.CryptocurrenciesThose Who Have Risen The Most:XCN →increased by 44.7% to $ 0.0122.FARTCOIN →increased by 39.5% to $0.7264.UXLINK →increased by 30.5% to $ 0.6213.FLR →increased by 26.1% to $ 0.0142.KET →increased by 25.6% to $0.1679.The Ones Who Fell The Most:SAROS → fell 19.5% to $0.1263.ZEC →fell 6.7% to $32.66.XTZ → fell 2.7% to $0.5653.KAITO → fell by 2.4% to $0.8199.EOS → fell 1.5% to $0.6568.Other Data:Fear Index:Bitcoin: 28Ethereum: 22Dominans:Bitcoin: 63.47% ▲ 0.37%Ethereum: 7.60% ▼ 2.28%Total Net ETF Inflows Per Day BTC ETFs: -127.20 Million$ ETH ETFs: -11.20 Million$ Data to Follow TodayCore Consumer Price Index (CPI) (Monthly) (Mar):Expectation: 0.3% / Previous:0.2%Consumer Price Index (CPI) (Annual) (Mar):Expectation: 2.5% / Previous: 2.8%Consumer Price Index (CPI) (Monthly) (Mar):Expectation: 0.1% / Previous:0.2%Applications for Unemployment Benefits:Expected: 223K | Previous: 219KGlobal MarketsGlobal markets started the day negatively when China increased the customs tariff on imported products from the United States from 34% to 84%. However, US President Donald Trump's “buying time” announcement via social media, followed by the announcement of the suspension of customs tariffs on countries other than China for 90 days, led to a sharp recovery in the markets. Following these developments, US stock markets experienced one of the strongest days in their history.The S&P 500 index ended the day with a premium of 9.51%, the Nasdaq by 12.16% and the Dow Jones by 7.87%. Strong purchases were followed in all sectors, especially technology shares. The tech giants of the so-called ”magnificent seven" gained an average value of 14.62%. The highest performances on a sectoral basis came from the technology (14.15%), discretionary consumption (11.36%) and telecommunications (10.00%) sectors. Cyclical commodities also had a positive trend; copper and oil in particular made strong premiums.According to Trump's statement, the mutual customs tariffs imposed against more than 75 countries that are open to negotiation with the United States and do not retaliate, except China, have been suspended for 90 days, and only a 10% tax will be applied to these countries. On the other hand, the tariff rate applied to China has been increased to 125%.The minutes of the Fed's March 18-19 meeting, published yesterday in the US, highlighted the high uncertainty in the economic outlook. The Fed had left interest rates steady in the December range of 4.25% - 4.50%. In the minutes, it was stated that the downside risks for employment and growth have increased, while the upward pressures on inflation have strengthened. In particular, it was stated that high customs tariffs could increase inflation, but it is unclear to what extent and for how long this will be effective.The Consumer Price Index (CPI) data for March, which will be announced today in the United States, is of critical importance for the markets. The expectations are that the headline CPI will increase by 0.1% per month and 2.5% per year, while the core CPI will increase by 0.3% per month and 3.0% per year. In addition, weekly applications for unemployment benefits will also be monitored. The CPI increased by 0.2% in the previous month, while annual inflation decreased from 3.0% to 2.8%.Asian stock markets are looking positive today. In Europe, on the other hand, Trump's statements are being priced in this morning after yesterday's declines, and futures indices are seeing rises approaching 8%. On the other hand, US futures indices are Decelerating between 0.5% -1.2% with some profit-taking this morning after yesterday's rise.The Most Valuable Companies and Their Stock PricesApple (AAPL) → market capitalization of $2.99T, price per share of $198.85, an increase of 15.33%Microsoft (MSFT) → market capitalization of $2.9T, price per share is $390.49, an increase of 10.13%NVIDIA (NVDA) → market capitalization of $2.79T, price per share of $114.33, an increase of 18.72%Amazon (AMZN) → market capitalization of $2.03T, price per share of $191.10, an increase of 11.98%Alphabet (GOOG) → market capitalization of $1.95T, price per share of $161.06, an increase of 9.88%Borsa IstanbulWhile there was a 2.1% decline in Borsa Istanbul yesterday, it is expected that the losses in the BIST 100 index will be compensated and the 9500 level will be tested with the positive outlook in global markets this morning. 9500 points is a critical level at which the descending channel resistance, which has been monitored since March 19, has passed, and it is possible for the upward movement to gain strength if this level is exceeded and permanence is ensured above it. While the 9473-9594 band is monitored as the first resistance zone above, the 9738-9895 December may come up if this band is exceeded. In the broader term, the 9953 point level is being followed as a major resistance.In the downward movements, 9221 points are in the first support position. Stronger supports are located in the 9044-8870 band. In case of possible sagging below this zone, the 8618 level can be re-tested.Domestically, industrial production and construction cost index data for February will be announced today. In January, industrial production fell by 2.3% on a monthly basis, adjusted for seasonal and calendar effects, and increased by 1.2% year-on-year, adjusted for calendar effects. These data will be closely monitored in terms of the course of economic activity. The Turkish 5-year CDS premium starts the day at 373 basis points.In general, Borsa Istanbul is expected to make a positive start today, while the technical levels and the data to be announced will be decisive on the intraday direction.The Shares That Increased The Most:INTEM → increased by 10.00% to TL 215.60.VERTU → increased by 10.00% to 33.66 TL.DMRGD → reached TL 16.74 with an increase of 9.99%.DOBUR → increased by 9.99% to 238.90 TL.BAGFS → became TL 26.24 with an increase of 9.97%.The Most Declining Shares:EUHOL → fell by -9.99% to TL 13.06.SEGMN → decreased by -9.09% to TL 23.00.CHIP → fell by -7.11% to 70.55 TL.TSPOR → fell by -5.56% to TL 1.02.SKTAS → -5.30% decrease was 5.00 TL.The Companies with the Highest Market Capitalization in Borsa Istanbul:QNB Finansbank (QNBTR) → Market capitalization of TL 1 trillion, price per share is TL 305.00, an increase of 1.84%.Aselsan Electronics Industry (ASELS) → Market value of TL 533.98 billion, price per share is TL 122.30, an increase of 4.44%.Garanti Bank of Turkey (GARAN) → Market capitalization of TL 444.36 billion, price per share is TL 107.30, an increase of 1.42%.Turkish Airlines (THYAO) → market value of TL 422.28 billion, price per share is TL 312.00, an increase of 1.96%.Koç Holding (KCHOL) → Market value of TL 391.29 billion, price per share is TL 152.60, a decrease of 1.10%.Precious Metals and Foreign Exchange PricesGold: 3814 TL Silver: 37.61 TL Platinum: 1146 TL Dollar: 37.97 TL Euro: 41.84 TL Hope to meet you again tomorrow with the latest news!
·
10 Apr 2025
Daily Market Summary with JrKripto 9 April 2025
You can find our article “Daily Market with JrKripto” below, where we have compiled the most important developments in global and local markets. Let's analyze the general market conditions together and take a look at the latest assessments.Bitcoin (BTC) is currently trading at $76,600. Maintaining this level in BTC, which is hovering near the $ 75,930 support, may allow the upward reactions to continue in the short term. If persistence is achieved above $ 75,930, the $82,819 level can be followed as the first strong resistance. With the overcoming of this resistance, gradual increases can be seen towards the $85,419 and $ 92,214 levels. On the other hand, if the $75,930 level is lost, the $73,804 support may come into play. In deeper declines, the levels of $69.615 and $67.496 may be raised.Ethereum (ETH) is trading at the $1,460 level and has sagged below the $1,486 support. If persistence is achieved below this level, the decline is likely to deepen to the level of $ 1,370. Further below, the $1,217 level can be viewed as the main support. The first resistance in the upward reactions will be $1,486. If this level is reached again, a recovery towards the December of $ 1,585 – $ 1,900 may be possible. A close above $2,000 could bring ETH targets of $2,277 and $2,428.Crypto NewsMastercard has partnered with Kraken to allow users in Europe to spend #Bitcoin at more than 150 million merchants worldwide.In the US, short-term interest rate futures traders are increasing their forecasts that the Fed will cut its policy rate in May.Canary has filed a SUI ETF application with the CBOE.Travis Hill, the Acting Head of the FDIC, said that they will issue additional guidelines on certain activities related to October #Bitcoin and crypto.The Justice Department dissolved the crypto unit in conjunction with Trump's withdrawal of digital asset regulations.Jeff Kendrick, head of research at Standard Chartered, said: "Bitcoin will be a protection against customs tariff risks this time.”CryptocurrenciesThose Who Have Risen The Most:GAS →jumped 35.1% to $2.65.NEO →jumped 9.1% to $5.45.LAYER →rose 5.5% to $1.49.DCR → rose 5.5% to $11.95.VENOM →rose 4.7% to $0.1269.The Ones Who Fell The Most:GRASS → fell 13.8% to $1.62.IBERA → fell 13.3% to $3.35.BERA → fell 11.7% to $3.42.FARTCOIN → fell by 11.4% to $0.5197.NEAR → fell 10.5% to $1.88.Other Data:Fear Index:Bitcoin: 21Ethereum: 15Dominans:Bitcoin: 63.46% ▲ 0.19%Ethereum: 7.34% ▼ 1.36%Total Net ETF Inflows Per Day BTC ETFs: -326.30 Million$ ETH ETFs: -3.30 Million$ Data to Follow Today17:30 → Energy Information Administration Crude Oil InventoriesExpectation: 2,200MPrevious: 6,165M21:00 → Federal Open Market Committee (FOMC) Meeting MinutesGlobal MarketsUS stock markets made a positive start to the day with strong reaction purchases, but turned down with the harsh news flow experienced during the day. In particular, former President Donald Trump's announcement that he had increased the customs duties imposed on China to 104% caused serious pressure on the markets. Trump cited the reason for this decision as China's failure to withdraw its retaliatory tax policies.This development led to one of the most volatile days in recent years in the US stock markets. The indices moved in a wide band from up to 4% rises to losses of up to 3% during the day. At the end of the day, the S&P 500 lost 1.57%, the Dow Jones lost 0.84%, and the Nasdaq lost 2.15%.All sectors in the S&P 500 index ended the day on the minus. The raw materials sector showed the weakest performance with 2.96%, followed by discretionary consumption with 2.54%, energy and real estate sectors with 2.45%. More defensive sectors such as finance, infrastructure and healthcare closed the day with more limited losses.Selling pressure also dominated in US government bonds. Rising interest rates and inflation concerns also had an impact on the bond market. On the other hand, the message of the US economic administration that “we will ignore the markets for a while during this period” indicates that there is no Deceleration expected in the markets and that high volatility may continue.These developments have also been effective in global markets. Although European stock markets closed positively yesterday, European futures are down by about 4% this morning. Asian stock markets are also watching sellers. The downward trend in US futures indices continues this morning as well.One of the important topics of today will be the announcement of the minutes of the US Central Bank (Fed) meeting. December March meeting, interest rates were left fixed in the range of 4.25% -4.50%, while the interest rate forecast for 2025 was maintained at 3.9%. However, after the recent developments and increasing trade tensions, expectations that the Fed may cut rates sooner have started to strengthen in the market.The Most Valuable Companies and Their Stock PricesMicrosoft (MSFT) → market capitalization of $2.64T, price per share of $354.56, down 0.92%Apple (AAPL) → market capitalization of $2.59T, price per share of $172.42, a decrease of 4.98%NVIDIA (NVDA) → market capitalization of $2.35T, price per share of $96.30, a decrease of 1.37%Amazon (AMZN) → market capitalization of $1.81T, price per share of $170.66, down 2.62%Alphabet (GOOG) → market capitalization of $1.77T, price per share of $146.58, down 1.78%Borsa IstanbulThere was a balanced course and a positive close in Borsa Istanbul yesterday. Foreign transactions and money inflows and outflows were balanced. However, selling pressure is expected to increase in the BIST this morning due to the weak outlook in global markets. For this reason, we are going through a period when the volatility in the market is high, it is necessary to be careful in short-term transactions, and it would be healthier to focus on long-term investments.The agenda of the day is calm. While there are no important data available in Turkey and Europe, the minutes of the Fed's meeting in the United States will be followed. Turkey's 5-year credit risk premium (CDS) started the day at 363 basis points.Domestically, the Treasury had a cash deficit of TL 298.4 billion in March and a primary deficit of TL 162.9 billion. Compared to the same period last year, deficits increased. In March, revenues increased by 51.8% and expenses by 58.3%. Thus, the Treasury posted a total deficit of TL 901 billion in the first quarter of the year.The Turkish Export Climate Index published by the Istanbul Chamber of Industry stood at 51.5 in March. This indicates a moderate improvement in the Sundays to which Turkey exports. While there has been an increase in production, especially in Germany, it is stated that the Middle East continues to be an important source of growth for Turkey.The Treasury borrowed a total of TL 102.8 billion through bond auctions held yesterday. the interest rate of the 4-year fixed coupon bond was 39.81%. In addition, 22.1 billion TL 2-year lease certificates were sold. Thus, the total borrowing amount this week reached TL 187.4 billion.Although the BIST 100 index fell to 9400 level yesterday, it closed at 9477 points with reaction purchases. Technically, the 9044 level stands out as short-term support. The December 9473-9594 is monitored as a resistance zone in upward movements. If these levels are exceeded, an increase towards the 9738-9895 December may be possible. However, if it falls below the 9044 level, the 8870 and then the 8618 levels may come up again.The Shares That Increased The Most:AKYHO → increased by 10.00% to 3.52 TL.SNPAM → increased by 10.00% to 68.20 TL.FINDINGS → reached TL 29.28 with an increase of 9.99%.DERHL → increased by 9.99% to 74.30 TL.CHIP → became TL 75.95 with an increase of 9.99%.The Most Declining Shares:EUHOL → fell by -9.99% to TL 14.51.BRKO → fell by -9.87% to TL 12.15.AKMGY → fell by -9.70% to TL 224.40.SNKRN → fell by -9.03% to TL 134.00.ATSYH → decreased by -8.42% to TL 47.44.The Companies with the Highest Market Capitalization in Borsa Istanbul:QNB Finansbank (QNBTR) → Market capitalization of TL 1.05 trillion, price per share is TL 301.50, a decrease of 3.75%.Aselsan Electronics Industry (ASELS) → Market value of TL 541.73 billion, price per share is TL 117.20, a decrease of 1.35%.Garanti Bank of Turkey (GARAN) → market value of TL 463.68 billion, price per share is TL 106.60, a decrease of 3.44%.Turkish Airlines (THYAO) → market value of TL 425.38 billion, price per share is TL 307.00, a decrease of 0.41%.Koç Holding (KCHOL) → Market value of TL 405.74 billion, price per share is TL 155.90, a decrease of 2.56%.Precious Metals and Foreign Exchange PricesGold: 3682 TL Silver: 37.29 TL Platinum: 1135 TL Dollar: 38.01 TL Euro: 42.06 TL Hope to meet you again tomorrow with the latest news!
·
9 Apr 2025
ETH: Comments and Price Analysis 09.04.2025
Ethereum (ETH): Key Levels to Watch in the Short and Mid-TermEthereum has recently held a significant position in the broader market, with its price action approaching key levels that are capturing the attention of investors. In this analysis, we’ll take a close look at the main support and resistance zones that could shape ETH’s upside potential in both the short and mid-term. ETH Support and Resistance Levels $1,410: Fundamental Support & Buyer StrengthThe $1,410 level marks a crucial support area where buyers have previously shown strength. If Ethereum maintains price action above this zone, there’s a strong likelihood of a move toward the resistance area between $1,615 and $1,643. Closing above this range would signal bullish momentum and strengthen the case for a potential rally. This level could serve as a roadmap for short-term price direction. However, if ETH falls below $1,410, it may trigger renewed selling pressure across the market.$1,836 – $1,805: SR Flip & POI Zone – The Decision-Making AreaThis region holds technical significance as it represents both an SR flip (support-turned-resistance) and a Point of Interest (POI). Daily closes within this range could set Ethereum on a course toward the next target at $2,058. Buying activity here would support bullish momentum and help reinforce market confidence.$2,533 – $2,722: High Timeframe Resistance & Trend FormationThese levels represent major resistance zones on higher timeframes. Historically, ETH has struggled to break through these levels, with declining volume and increased profit-taking often observed in this range. A decisive breakout above this resistance could spark a new mid-term uptrend. On the other hand, if ETH fails to breach these levels, sideways movement may continue, driven by persistent selling pressure. This area is a critical test zone that could determine Ethereum’s future direction.$3,400 and $5,000: Key Targets for Institutional Investors & the Layer 2 EffectLonger-term targets like $3,400 and $5,000 are closely watched by institutional players. Sustained price action above $3,400 could open the door for ETH to enter price discovery mode, with $5,000 becoming a realistic target. A breakout at these levels wouldn’t just benefit Ethereum—it could also spark significant inflows into Layer 2 projects. Standout names like OP, ZKSYNC, ARB, and STRK may experience notable capital rotation as ETH gains traction.Final ThoughtsEthereum is currently trading at critical levels. Breakouts and closes around these zones will play a key role in determining ETH’s short- to mid-term trajectory. How buyers and sellers react in these areas will serve as an important signal for where Ethereum may be headed next.Disclaimer: This analysis does not provide investment advice. It focuses on support and resistance levels that may offer potential trading opportunities based on current market conditions. All trading decisions and risk management are the sole responsibility of the individual. The use of stop-loss strategies is strongly recommended.
·
8 Apr 2025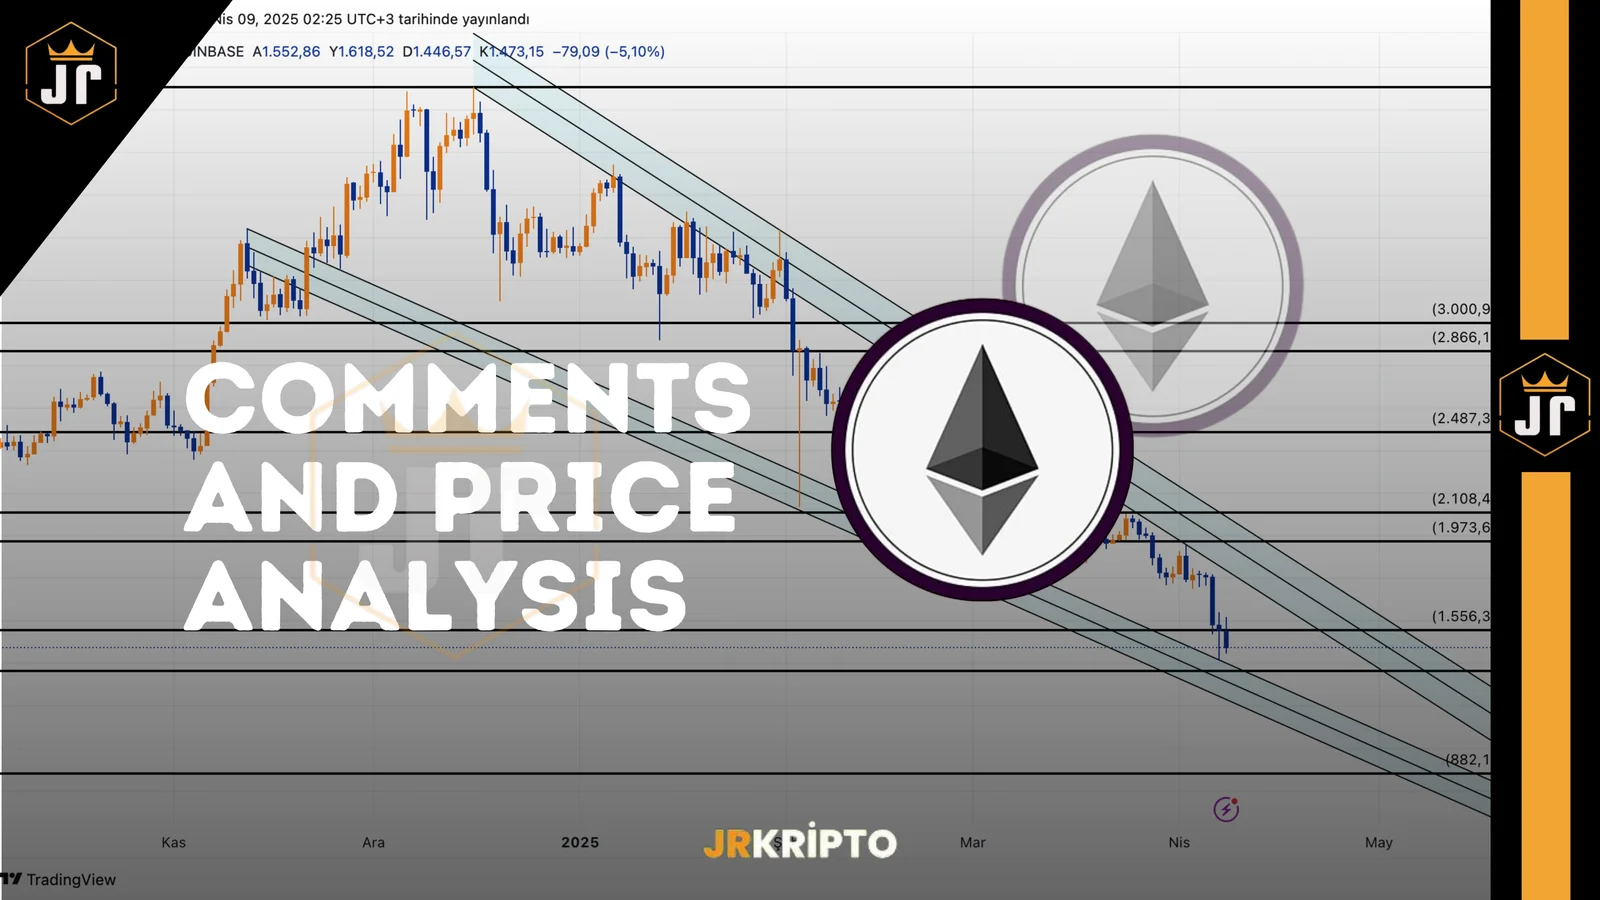
BTC and USDT.D: Comments and Price Analysis 09.04.2025
Bitcoin (BTC) and the Latest Crypto Market Outlook: Key Levels and Trend-Defining IndicatorsAs the cryptocurrency market continues to revolve around Bitcoin’s price action, all eyes are on the critical levels highlighted by technical analysis. As of April 2025, global economic volatility, signals from the U.S. Federal Reserve regarding monetary policy, and Bitcoin dominance are all pointing toward a potential major breakout.In this analysis, we’ll dive into Bitcoin’s key support and resistance zones, the structure of USDT dominance, and how macroeconomic developments could impact the market. BTC Macro Bottom Zone Key Technical Levels for Bitcoin$73,336 – Historical Bottom Zone (Macro Support)Bitcoin previously marked this level as a major bottom before rallying 2.5x. It remains a psychologically and technically important area. If the price revisits this zone, strong buying pressure could re-emerge as it did in the past.$79,618 – Daily Close LevelA confirmed daily close above this threshold could turn the short-term outlook bullish. This level signals buyers regaining control and may serve as a short-term trend indicator.$85,000 - $86,400 – POI (Point of Interest)This zone is where buyers and sellers have historically clashed. A strong breakout here, backed by high volume, could be decisive for momentum. It may also act as a key profit-taking level.$90,500 – Liquidity Cluster and ResistanceThis is a heavy resistance zone with accumulated stop-loss orders and pending trades from short-term players. A breakout here could trigger sharp movements due to liquidity release.$94,700 - $96,900 – NPOC and Critical ResistanceThis range, known as a "Naked Point of Control" (NPOC), represents a high-volume area where past price action failed to find equilibrium. If Bitcoin breaks through with volume, it could clear the path toward the $100,000 milestone. This area may also be a spot where investors re-enter positions.What Are the Macroeconomic Indicators Telling Us?Global economic shifts are directly impacting the crypto markets. One of the most notable recent events is former President Donald Trump’s public plea to the Federal Reserve:“Cut interest rates now!”Markets quickly responded. Futures contracts began pricing in a total of 120 basis points in rate cuts by year-end. Rate cuts imply more liquidity entering the system, which could create a major opportunity for limited-supply assets like Bitcoin.Overall Market OutlookTechnical indicators suggest Bitcoin is on the verge of a major breakout. The $73,336 level could serve as a strong accumulation zone for long strategies, while the upper resistance levels are the gateways to a potential bull market. A sustained move above $94,700 could bring a test of the $100,000 psychological barrier.Meanwhile, the prospect of Fed rate cuts combined with signs of global monetary expansion strengthens the technical case for a bullish scenario in the second half of 2025.USDT Dominance (USDT.D) Technical Analysis – Key Levels and Potential ScenariosUSDT Dominance (USDT.D) is one of the most important indicators for analyzing investor sentiment in crypto markets. Rising dominance suggests risk aversion, while declining dominance signals growing risk appetite. USDT.Decision Zone D Below is a breakdown of the key technical levels and potential scenarios:5.03% – Level That Could End Selling PressureThis has historically been a bottom zone where the market has rebounded and shifted toward risk assets. A weekly close below this level would suggest a move back into Bitcoin and altcoins. Dropping below this area could signal the start of an altcoin season.5.41% – 5.46% Range: Strong Seller ZoneThis resistance zone has repeatedly triggered sell-offs and flows back into USDT. While currently broken, it's essential to watch if it will act as support on a retest.6.20% – 6.89% Range: Macro Zone to End Selling PressureThis range marks one of the historically highest USDT dominance zones and often coincides with major market pullbacks. If dominance rises to this level again, market panic may increase, but this zone also frequently marks trend reversals. Approaching this area could present entry opportunities in altcoins.Disclaimer: This analysis does not provide investment advice. It highlights support and resistance levels that could present potential short- to medium-term opportunities depending on market conditions. All trading decisions and risk management remain the responsibility of the individual. Stop-loss strategies are strongly recommended for all trades.
·
8 Apr 2025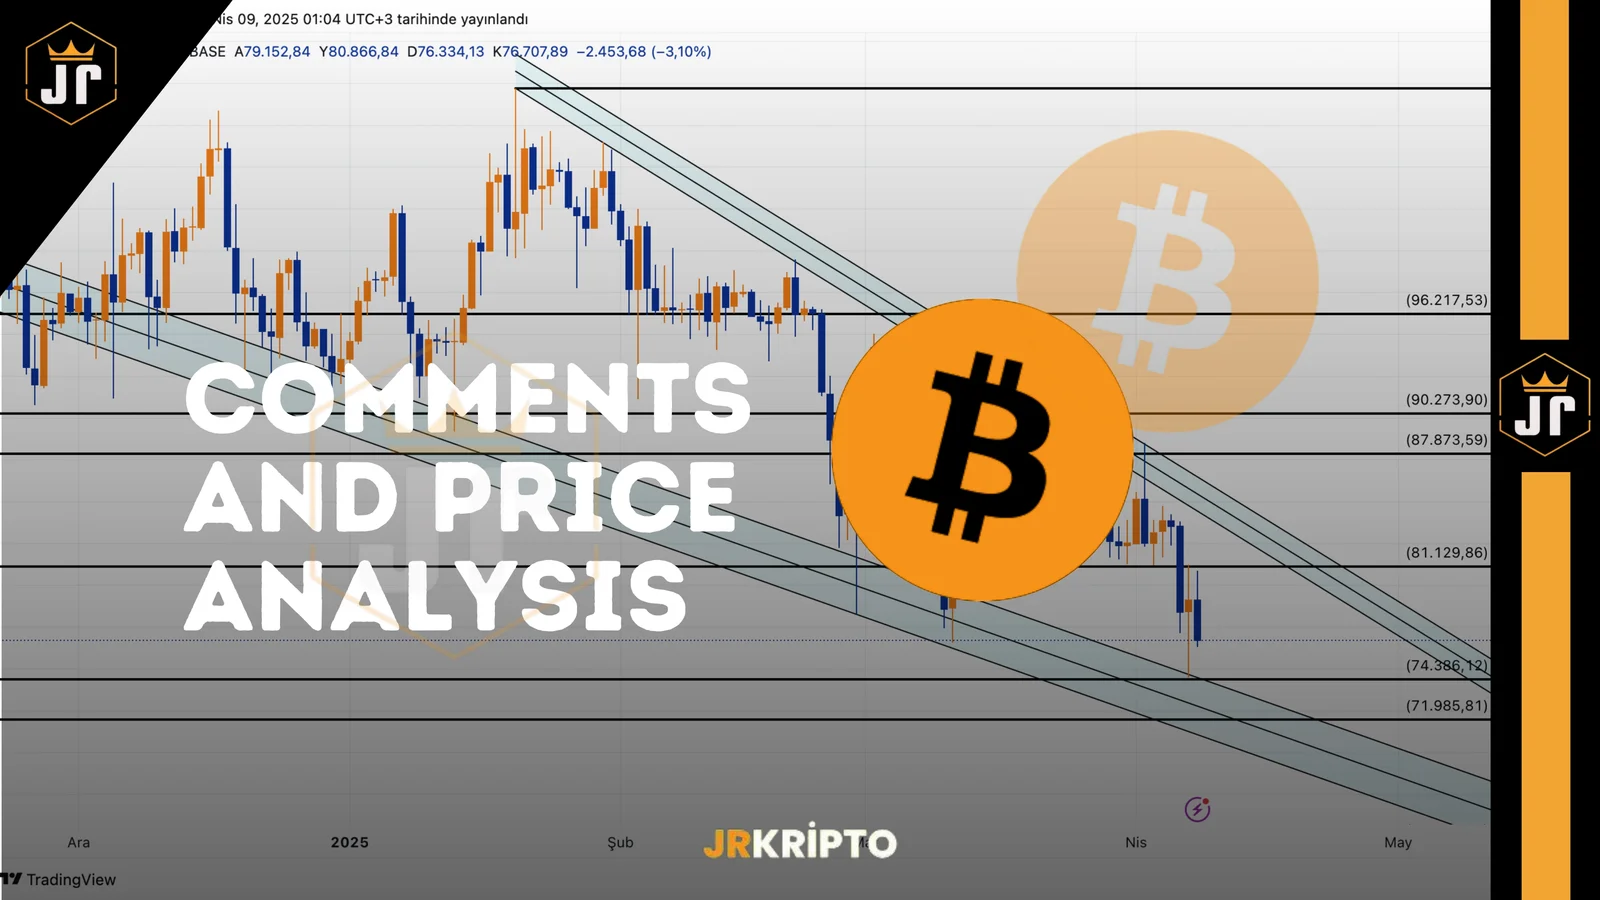
The US Department of Justice Has Dissolved the Crypto Task Force
In a move that’s bound to spark major discussion across the crypto space, the U.S. Department of Justice (DOJ) has officially disbanded the National Cryptocurrency Enforcement Team (NCET), which had been active since 2021. This unexpected development brings a sense of relief to many in the crypto industry who’ve long struggled with regulatory uncertainty.Earlier this year, former President Trump signed an executive order calling for clearer and more enforceable digital asset regulations. The DOJ’s latest decision appears to align with that broader shift in tone and policy.“We’re Not a Regulator,” Says DOJ OfficialDeputy Attorney General Todd Blanche made waves with a candid statement: “We’re not a regulatory agency.” He also acknowledged that, during the Biden administration, the DOJ had felt pressured to regulate the industry through litigation rather than clear guidelines. For those who’ve been closely following the space, this admission sheds light on the legal chaos many have criticized for years.What Was NCET’s Role?NCET was launched in 2021 under President Biden, tasked with tackling everything from money laundering to illicit crypto transactions. It played a central role in legal actions against major players like Binance and KuCoin. But moving forward, the DOJ is expected to shift its focus toward individual criminal behavior, potentially giving blockchain projects and infrastructure providers more breathing room.What Does This Mean for the Crypto Industry?Less Pressure on the SectorCrypto entrepreneurs, many of whom have faced funding challenges or delayed their projects due to fear of sudden legal action, may now find renewed confidence. The looming threat of waking up to an SEC or DOJ lawsuit appears to be easing.A Safer Environment for InvestorsAs regulatory guidelines become clearer, institutional investors are more likely to re-enter the market. The industry is slowly moving from a legal gray zone to more well-defined rules.Big Money May Be Ready to EnterTrump’s softer stance on regulation could reignite interest from billion-dollar funds and traditional finance giants that had previously taken a cautious approach toward digital assets.A New Chapter for EntrepreneursWith investigations scaling back, developers in sectors like DeFi and Web3 may feel emboldened to innovate. The coming months could usher in a wave of fresh ideas and projects.A Shift in the U.S. Approach to CryptoThe shutdown of NCET is more than just an administrative move—it’s a clear signal that the U.S. is trying to understand and work with the crypto industry, not against it. Regulation is beginning to evolve into a collaborative framework rather than a fear-inducing threat. And that could be the foundation for sustainable, long-term growth in the digital asset space.
·
8 Apr 2025
Pakistan Appoints Former Binance CEO CZ as Crypto Consultant
One of the most prominent figures in the cryptocurrency world, Changpeng Zhao (CZ)—the founder of Binance—has taken a central role in shaping Pakistan’s digital economy vision. CZ has officially been appointed as a strategic advisor to the Pakistan Crypto Council (PCC), marking a major step in the country’s efforts to integrate blockchain technology into its economic framework and accelerate crypto adoption.Government-Level Support for Digital TransformationThe announcement came shortly after CZ’s recent visit to Pakistan, where he held high-level meetings with key government officials. During his trip, CZ met with the Prime Minister, Deputy Prime Minister, Finance Minister Muhammad Aurangzeb, as well as representatives from the State Bank of Pakistan and the Securities and Exchange Commission.These meetings focused on Pakistan’s growing vision for digital finance and blockchain adoption. Finance Minister Aurangzeb emphasized that the country’s Web3 and digital asset strategy is rapidly evolving, and noted that CZ’s experience would be crucial in shaping this transformation.A Young, Crypto-Ready PopulationAccording to CZ, Pakistan presents an ideal environment for crypto adoption. With over 60% of the population under the age of 30, and strong enthusiasm for technology, the country has enormous potential for scaling blockchain-based solutions.CZ’s Key Priorities in Pakistan:Establishing transparent and compliant crypto regulationsEnhancing digital payment systems and financial infrastructurePromoting blockchain education and expanding real-world use casesThis isn’t CZ’s first government advisory role—he recently assumed a similar position in Kyrgyzstan, reflecting his growing influence in public policy across Asia. His involvement signals a broader effort to support national digital transformation strategies, beyond the private sector.A Strategic Move Toward Regional LeadershipPakistan’s decision to appoint CZ as a strategic advisor highlights the country’s serious commitment to crypto regulation and infrastructure development. This move could attract global investors’ attention and position Pakistan as a regional leader in digital finance.
·
8 Apr 2025
Daily Market Summary with JrKripto
You can find today’s edition of “Daily Market with JrKripto,” where we compile the most important developments in global and local markets, below. Let’s analyze the general market conditions together and take a look at the latest assessments.Bitcoin (BTC) is currently trading at $79,000. Following a reaction from the $75,930 level, an upward movement has started. As long as it stays above this level, the $82,819 resistance could be tested again. If the $82,819 level is surpassed, BTC may continue to rise towards $85,419 and $92,214 respectively. However, in case of a pullback, the $75,930 support could come into play again. If this level is lost, the decline may deepen to $73,804.Ethereum (ETH) is trading at $1,565. Holding above the $1,486 support seems to have limited the selling pressure. In upward recoveries, the first resistance is at $1,585. If this level is broken, ETH is expected to start a move towards $1,900 and $2,000. Daily closes above $2,000 could lay the groundwork for acceleration to $2,277 and $2,428. In the downward scenario, falling below the $1,486 level may bring pullbacks to the $1,370 and then $1,217 support levels.Crypto NewsBinance announced its initial voting results and will delist the following coins on April 16, 2025: BADGER, BAL, BETA, CREAM, CTXC, ELF, FIRO, HARD, NULS, PROS, SNT, TROY, UFT, and VIDT.Trump: We are lowering prices and interest rates.Pakistan appointed CZ as a strategic advisor on cryptocurrencies.White House Trade Advisor Navarro: “We expect the market to find a bottom.”European Commission President von der Leyen announced that the EU is ready to negotiate customs tariffs with the U.S.Strategy reported a paper loss of $5.91 billion from Bitcoin in the first quarter.Trump: The Fed is moving slowly, it should cut interest rates!Fed funds futures now price in 120 basis points of rate cuts for this year.CryptocurrenciesTop Gainers:FARTCOIN → Up 24.6% to $0.5784CORE → Up 19.2% to $0.4818HYPE → Up 17.7% to $11.93ZEC → Up 17.1% to $34.59KCS → Up 16.8% to $9.32Top Losers:BERA → Down 9.2% to $3.88IBERA → Down 8.5% to $3.90ELF → Down 6.9% to $0.2112LAYER → Down 5.8% to $1.40BTSE → Down 4.3% to $1.09Other Data:Fear Index:Bitcoin: 25Ethereum: 25Dominance:Bitcoin: 63.48% ▼ 0.09%Ethereum: 7.69% ▲ 1.58%Daily Total Net ETF Inflows:BTC ETFs: -$103.90 MillionETH ETFs: $2.10 MillionGlobal MarketsU.S. futures started the week with sharp losses, but indices showed strong recovery following reports that Trump may consider delaying tariffs for countries other than China by 90 days. However, this report was denied by the White House, leading to renewed market volatility. By the end of the day, indices closed with slight losses after a volatile session.S&P 500 saw the highest trading volume in recent times. At the close, the S&P 500 fell by 0.23%, the Dow Jones by 0.91%, while the Nasdaq ended the day with a slight gain of 0.10%. Only 2 out of 11 main sectors closed in the green: Telecommunications gained 1.03%, and technology rose by 0.32%. On the other hand, real estate dropped 2.40%, materials by 1.65%, and infrastructure by 1.53%, making them the weakest sectors.There was notable volatility in the bond market. The 2-year U.S. Treasury yield fell to as low as 3.44% during the day but closed at 3.78%. Gains in the 10-year yield were erased by the end of the session.In today’s economic data agenda, the EIA’s weekly crude oil inventory report stands out. Asian markets started the day with strong gains. European indices are expected to open positively.U.S. tariffs on all countries continue to create volatility in global markets. News flow on the issue changes frequently and sometimes leads to misinformation. While some reports suggest that tariffs may be postponed or softened, others claim they could be increased further. These uncertainties are increasing market fluctuations.Most Valuable Companies and Stock PricesApple (AAPL) → $2.73T market cap, $181.46 per share, ▼ 3.67%Microsoft (MSFT) → $2.66T market cap, $357.86 per share, ▼ 0.55%NVIDIA (NVDA) → $2.38T market cap, $97.64 per share, ▲ 3.53%Amazon (AMZN) → $1.86T market cap, $175.26 per share, ▲ 2.49%Alphabet (GOOG) → $1.80T market cap, $149.24 per share, ▲ 1.02%Borsa IstanbulBorsa Istanbul continues to be affected by global market volatility. Yesterday, the BIST 100 index dropped to 9,050 at the start of the week but tested 9,500 throughout the day due to reaction buying, closing at 9,407 points. This morning, signs of recovery are seen in foreign markets. Accordingly, upward moves in BIST may continue, and the 9,500–9,600 resistance zone could be tested again.Due to high volatility, caution is advised for short-term investments. Despite attractive valuations, investors are advised not to rush in the medium to long term.Support zone: 9,000–9,200Resistance zone: 9,500–9,600Breakout above 9,473–9,594 could lead to 9,738–9,895Critical support: 9,044–8,870, with a potential drop to 8,618 if breachedThe 12-month target for BIST 100 remains above 14,000. However, future revisions may lower this estimate. Nonetheless, strong long-term return potential is still indicated.Today’s Domestic Data: Treasury bond and lease certificate auctions are in focus. Yesterday, the Treasury borrowed ₺62.6 billion in a 2-year fixed coupon bond auction with an average compound interest rate of 47.36%. Today, the Treasury’s cash balance data will be released. In February, the cash balance posted a deficit of ₺397.6 billion, and the non-interest balance showed a deficit of ₺265.9 billion.Internationally, U.S. wholesale data and Fed minutes are on the agenda. Turkey’s 5-year CDS (credit default swap) level starts the day at 362 basis points, after peaking at 380 yesterday—indicating rising risk perception in the markets.In Conclusion: Borsa Istanbul is expected to open positively in line with global recovery efforts. However, caution is warranted in the short term as high volatility may continue, with sudden shifts depending on global developments.Top Gainers in Borsa Istanbul:KFEIN → +10.00% to ₺127.60DAGHL → +9.97% to ₺88.80DERHL → +9.93% to ₺67.55ETILR → +9.92% to ₺12.96CEMAS → +9.85% to ₺4.35Top Losers in Borsa Istanbul:EUHOL → -9.99% to ₺16.12AFYON → -7.39% to ₺14.03SEKUR → -4.97% to ₺15.11PAPIL → -4.83% to ₺35.88SKBNK → -4.73% to ₺5.24Top Market Cap Companies in Borsa Istanbul:QNB Finansbank (QNBTR) → ₺1.06 trillion market cap, ₺317.25 per share, 0.00% changeAselsan (ASELS) → ₺532.15 billion, ₺117.60 per share, ▲ 0.77%Garanti Bank (GARAN) → ₺461.16 billion, ₺109.40 per share, ▼ 0.36%Turkish Airlines (THYAO) → ₺427.80 billion, ₺309.75 per share, ▼ 0.08%Koç Holding (KCHOL) → ₺401.69 billion, ₺158.90 per share, ▲ 0.32%Precious Metals & Exchange RatesGold: ₺3,673Silver: ₺36.94Platinum: ₺1,128USD/TRY: ₺38.01EUR/TRY: ₺41.51See you again tomorrow with the latest updates!
·
8 Apr 2025
EDU: Comments and Price Analysis 08.04.2025
EDU Technical Analysis: The Fallen Channel Is Broken, Is a New Page Being Opened?EDU failed to make a break in the downtrend after touching the upper channel of the line in our analysis on March 25 and experienced a pullback to the lower channel of the trend. Despite the customs crisis, while all altcoins fell, today they broke this formation with a rise of 50%.Today, the price has reached the level of $ 0.1419. The fact that the negative structure that has been going on for months has been broken out may indicate that expectations in the market have changed and the investor is getting hopeful again. EDU Upward Fracture of the Falling Wedge The falling channel structure on the chart had dragged the price down in a very disciplined way. However, the price that was thrown out of the channel with today's strong green candle indicates that a different scenario can be discussed now. Such fractures, especially if they come after a long-term compression, can have a serious potential behind them.The price is currently based on the initial resistance at the level of $ 0.1461. If this zone is passed, the next targets are located much higher up.Support and Resistance LevelsSupports:$0.1160 – $0.1100: New support area, upper band of the broken channel$0.0900: The last intra-channel dip level$0.0770: Main supportResistors:$ 0.1461: Current resistance – the first test after the breakdown$0.1927 – $0.2108: Medium-term strong resistance zone$ 0.2710: The main target region – the level at which the channel decline begins0.3484 – 0.3810 $: The area where the volume sales come from$0.5025: Long-term resistance – big return targetThis break may be a signal not only of a short-term rise, but also of the beginning of a new era. If the closures above $0.1461 continue to come, it is highly likely that the upward movement will continue. In this case, the first target may be 0.1927 – 0.2100 dollars, and then the December of 0.27 – 0.35 dollars may be raised.Therefore, the smartest thing to do right now is to observe whether it will be permanent above this level. Because the trend has been broken, but it may take a while for the new trend to sit down.As a result, a whole new story may be starting for EDU. The last few months have been quite challenging. But this hard break today may be the harbinger of a brand new beginning both from a technical point of view and from the point of view of investor psychology. Moving out of the falling channel is not only a graphical change; it is also an indication that expectations are starting to change upwards. If this fracture becomes permanent, completely different levels can be discussed for EDU now.These analyses, which do not offer investment advice, focus on support and resistance levels that are thought to create trading opportunities in the short and medium term according to market conditions. However, the responsibility for making transactions and risk management belongs entirely to the user. In addition, it is strongly recommended to use stop loss in relation to shared transactions.
·
7 Apr 2025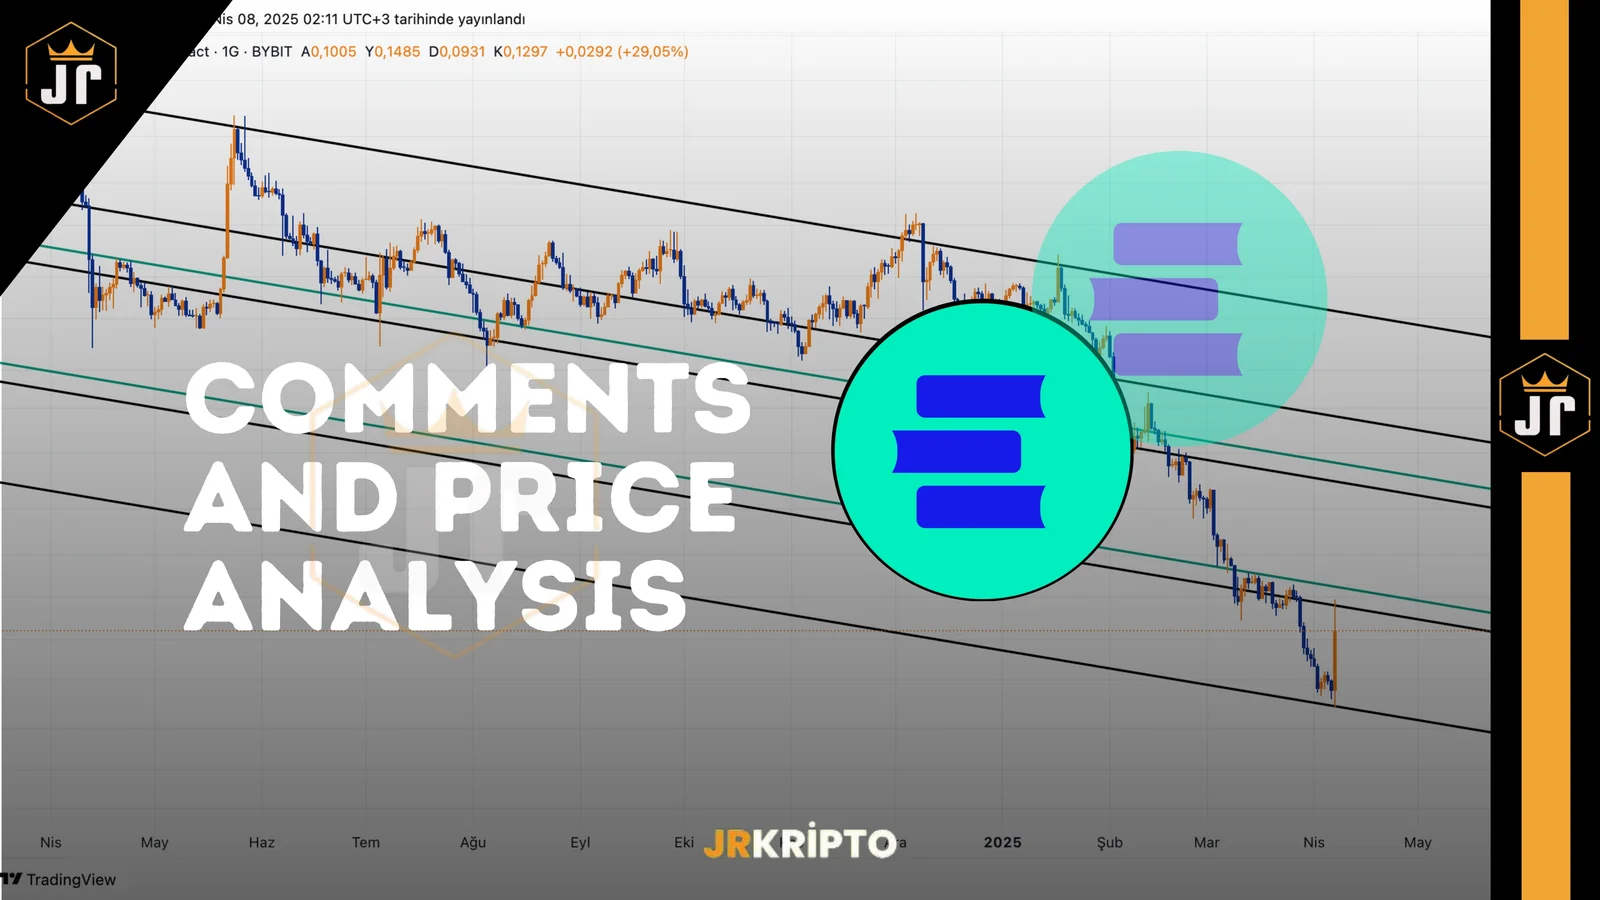
The Clear Message to the Fed“ "Cut Interest Rates!”
U.S. President Donald Trump has once again shaken the global economic landscape with a wave of bold statements. From calling for aggressive interest rate cuts to threatening new tariffs and responding to market turbulence, the messages coming out of the White House suggest the beginning of a new economic era. Trump’s declaration—"This is an economic revolution, and we will win. The result will be historic."—signals an ambitious, high-stakes strategy for 2025.Trump to the Fed: “Cut Interest Rates Now!”In a direct message to the Federal Reserve posted on the social media platform Truth Social, Trump declared, “The Fed is moving too slowly—it must cut rates!” The markets reacted immediately. Futures contracts tied to Fed interest rates began pricing in expectations for up to 120 basis points in rate cuts by the end of the year.This isn’t the first time Trump has pressured the Fed. During his previous term, particularly at the height of the COVID-19 pandemic, he successfully pushed for aggressive monetary easing—moves that helped fuel record rallies in both stock and crypto markets. Now, he appears to be setting the stage for a similar playbook.Trump's strategy seems aimed at propping up market confidence and stimulating economic growth through looser monetary policy ahead of a potentially volatile period.“Don’t Be Weak, Don’t Panic”: Market Reassurance Amid Tariff ShockMarkets saw sharp drops across equities and crypto assets following Trump’s tariff threats. Yet in the same breath, Trump issued a firm message to investors: “Don’t be weak. Don’t be stupid. Don’t panic.” This dual-tone message both underlined his assertive approach and served to calm jittery markets.White House Trade Adviser Peter Navarro reinforced the administration’s stance, stating, “We expect the market to find a bottom,” hinting at confidence in an upcoming recovery. This has sparked investor speculation that a new round of monetary stimulus and market support may be on the horizon.For crypto markets in particular, the potential for rate cuts is significant. Historical patterns show that Bitcoin and altcoins have often surged during periods of aggressive Fed easing.A New Era for the Global Economy?Trump’s current economic strategy pairs tough trade stances—particularly targeting China—with monetary stimulus aimed at domestic markets. It’s a two-pronged approach: reshaping global trade balances while simultaneously ensuring liquidity at home.A closed-door Federal Reserve Board meeting is rumored to have focused on this very issue, fueling speculation that policy shifts are imminent. If rate cut expectations materialize, the ripple effects will extend well beyond the U.S., potentially triggering global capital flow shifts and renewed investment momentum across multiple markets.Key Highlights:Trump: “This is an economic revolution. The result will be historic.”Fed rate cut expectations now priced in at 120 basis points.White House: “We expect the market to find a bottom.”Rate cut pressure may fuel a crypto market rebound.Stocks and digital assets could rally on further easing and stimulus policies.Conclusion: A Turning Point for Markets and Policy?Trump’s aggressive economic messaging may be the beginning of a transformative period for global markets. Whether it’s interest rate cuts, tariff escalations, or a combination of both, the weeks ahead promise high volatility—but also high opportunity. For investors, especially in crypto and equities, this could be the setup for a major rebound—if the Fed plays along.
·
7 Apr 2025
Harsh Messages from Trump on Customs Duties and Global Trade: Is It the Beginning of a New Era?
U.S. President Donald Trump has once again taken center stage in the global trade conversation, delivering statements that sent shockwaves through international markets. His bold remarks—especially regarding new tariffs on China and the launch of fresh trade negotiations with other countries—have triggered sharp market reactions and could prompt nations to reassess their economic and diplomatic strategies.A Clear Warning to China: Tariffs Could Rise to 50%In a striking announcement, Trump warned that if China fails to remove the current 34% additional tariffs, the U.S. would raise them to 50%. This declaration has cast a shadow of uncertainty over U.S.-China trade relations, reigniting tensions that could have significant economic ripple effects.While Chinese officials labeled the move as “economic bullying,” President Trump described the potential hike as a “painful but necessary remedy.” US and China Tensions 90-Day Tariff Suspension? Mixed Signals Create ConfusionAdding to the uncertainty, Trump’s economic adviser Kevin Hassett mentioned a possible 90-day suspension of tariffs for countries other than China. However, White House officials quickly denied any such plans, calling the reports “baseless.” Trump himself took to Truth Social to post a cryptic and forceful message: “Don’t be weak. Don’t be stupid. Don’t panic.”The conflicting messages have only deepened the ambiguity surrounding U.S. trade policy.Green Light for New Trade Talks (Excluding China)While tensions with China escalate, Trump announced the U.S. will begin immediate trade negotiations with other countries. European Commission President Ursula von der Leyen confirmed the EU is ready to enter talks, and the U.S. National Economic Council reported that over 50 countries have already reached out to initiate new trade agreements with Washington.This diplomatic pivot could signal a shift in U.S. trade strategy toward forging selective bilateral deals.Market Reactions and Global ResponsesThe financial markets reacted swiftly to Trump's statements. The S&P 500 plummeted, and the U.S. dollar weakened. Canada responded by filing a complaint with the World Trade Organization (WTO) over the 25% tariffs imposed on cars, while Japan’s Prime Minister Shigeru Ishiba publicly urged Trump to reconsider the aggressive tariff policy.These international reactions underscore the widespread concern about the impact of Trump's trade decisions on global economic stability.Trump’s Message to the Fed: “Rate Cuts Needed”In another sharp statement via Truth Social, Trump criticized the Federal Reserve, saying, “The slow-moving Fed must cut rates.” While some interpreted the tariff announcements as pressure on the Fed, Kevin Hassett clarified that the trade measures are not intended to influence monetary policy.Still, the tension between fiscal and monetary policy continues to grow under the current administration.Key Takeaways:Trump threatens to raise China tariffs from 34% to 50% if changes aren’t made.Over 50 countries have approached the U.S. for new trade agreements.White House denies reports of a 90-day tariff suspension.EU expresses readiness to negotiate with the U.S.Trump’s message: “Don’t be weak. Don’t be stupid. Don’t panic.”What’s Next?Trump’s aggressive trade stance may mark the beginning of a new era in global economics. The combination of tariff threats and simultaneous diplomatic outreach suggests a potential overhaul of international trade norms. In the coming days, both the U.S. economy and global markets could face pivotal developments that redefine the balance of trade and diplomacy.
·
7 Apr 2025
Daily Market Summary with JrKripto
You can find our article “Daily Market with JrKripto” below, where we have compiled the most important developments in global and local markets. Let's analyze the general market conditions together and take a look at the latest assessments.Bitcoin (BTC) is currently trading at $76,434. While the $ 75,930 region stands out as a critical support, if this level is lost, the decline may deepen to the $ 73,804 level. If the downward pressure continues, the levels of $69.615 and $67.496 can be followed as the next support zones. In the upward movements, the first resistance is found at the level of $ 82.819. If this level is exceeded, BTC may rebound towards the levels of $85,419 and $92,214. For a stronger rise, the closes above $92,214 can start a new rally to the level of $109,705.Ethereum (ETH) is trading at $1,492. The price is tracking quite close to the $1,486 support. If it goes below this level, the decline may last up to the $ 1,370 level. In deeper corrections, the $1,217 level can be followed as support. The first resistance in the upward recoveries is at the level of $ 1.585. If this level is exceeded, the $1,900 and $2,000 levels may become the target. If closures above $2,000 come, a new upward momentum may occur for ETH towards the $2,277 and $2,428 levels.Crypto News$ 1,350,000,000 has been liquidated from the cryptocurrency market in the last 24 hours.The expectation of an interest rate cut this year in Fed fund maturities has increased to 120 basis points.The S&P 500 futures opened down 4 percent, while the Nasdaq futures fell 5 percent.Tether plans to release a new stablecoin for the US Sunday this year if Congress passes the legislation.The SEC has announced that fully-reserve, liquid, dollar-backed crypto stablecoins are not securities.CryptocurrenciesThose Who Have Risen The Most:The BTSE →gained 10.3% to $1.14.SAROS →rose 1.8% to $0.1559.KAVA → rose 1.3% to $0.4096.GRASS → rose 1.0% to $1.72.FDUSD →increased by 0.6% to $1.00.The Ones Who Fell The Most:IBERA → fell 26.1% to $4.28.BERA → fell 25.8% to $4.27.MEW → fell by 24.8% to $0.0020.ZEC → fell 22.9% to $29.17.SNEK →fell by 22.7% to $0.00023.Other Data:Fear Index:Bitcoin: 27Ethereum: 19Dominans:Bitcoin: 63.51% ▲ 0.33%Ethereum: 7.74% ▼ 0.36%Total Net ETF Inflows Per Day BTC ETFs: -64.90 Million$ ETH ETFs: $2.10 Million Global MarketsAfter the announcement of the customs duties, there was a hard sell in global markets and stock indexes lost a total of US$6.1 trillion in market capitalization. On the last trading day of the week, the S&P 500 index fell by 5.97%, the Dow Jones by 5.50%, and the Nasdaq by 5.82%. While all sectors ended the day with losses, the sharpest declines were seen in the energy (8.70%), finance (7.39%) and technology (6.33%) sectors. These hard sales took place in conjunction with increasing recession concerns.On the other hand, the October non-agricultural employment (TDI) data, which exceeded expectations, put additional pressure on the market. In March, TDI data showed an increase of 228 thousand, well above the expectation of 137 thousand. Most of the increase came from service sectors such as healthcare, social assistance, transportation and warehousing. Despite this strong employment data, the unemployment rate rose from 4.1% to 4.2%. The labor force participation rate increased from 62.4% to 62.5%, while the number of unemployed remained stable at 7.1 million in February. Average hourly earnings increased by 0.3% on a monthly basis, while the annual increase slowed from 4.0% to 3.8%.Fed Chairman Jerome Powell pointed out the inflationary effects of tariffs and stated that a rate cut would be risky in this environment. These statements postponed the expectations of an interest rate cut.In the bond market, the demand for safe havens continues. The US 2-year bond rate fell to 3.48% and the 10-year bond rate fell to 3.90%. While China has signaled retaliation against the US customs duties, trade ministers in the European Union are expected to discuss how to respond to this tax package.With the impact of all these developments, Asian stock markets are priced with sharp declines, while European stock markets are expected to have a negative start to the day.The Most Valuable Companies and Their Stock PricesApple (AAPL) → market capitalization of $2.83T, price per share is $188.38, a decrease of 7.29%.Microsoft (MSFT) → market capitalization of $2.68T, price per share is $359.84, a decrease of 3.56%.NVIDIA (NVDA) → market capitalization of $2.30T, price per share is $94.31, a decrease of 7.36%.Amazon (AMZN) → market capitalization of $1.81T, price per share of $171.00, a decrease of 4.15%.Alphabet (GOOG) → market capitalization of $1.79T, price per share of $147.74, a decrease of 3.20%.Borsa IstanbulAlthough the hard selling in global markets has been accompanied in a more limited way due to the serious depreciation experienced in Borsa Istanbul in the period after March 19, the weak trend continues. A selling start is also expected for the new week. In this process, it is emphasized that the short-term position risks should be kept low, and despite attractive valuations, there should be no rush for medium- and long-term investments. In the BIST 100 index, the 9,000 - 9,200 levels can be monitored as support, and the 9,500 - 9,600 levels can be monitored as resistance.Treasury auctions and foreign securities transactions announced by the CBRT will stand out on the agenda of the day, while the trust indices to be announced in Europe will also be on the radar of the markets. Inflation data to be announced in the US later in the week are among the important agenda items Dec. Turkey's 5-year CDS premiums start the day at 348 basis points. In addition to internal risks, global economic weakness due to the United States is also influential in the October rise in CDS.According to the provisional data released by the Ministry of Commerce domestically, exports increased by 3.2% year-on-year to $ 23.4 billion in March, while imports increased by 2.3% to $ 30.7 billion. Thus, the foreign trade deficit remained stable at $ 7.3 billion, and the 12-month cumulative foreign trade deficit remained horizontal at $84.5 billion.February March CPI accelerated by 2.6% on a monthly basis compared to the previous month (February: 2.3%), according to the seasonally adjusted data of TURKSTAT. On the other hand, the monthly increases in the core B and C indices slowed down compared to February with 1.9% and 2.2%, respectively. While the price increase in the service group decreased to 3.0%, the prices of goods increased to 2.4%.In March, the CPI-based real effective exchange rate (REDK) decreased by 1.6 percentage points compared to the previous month and became 73.5. This level marks an increase of 17% compared to the same period last year. While the PPI-based REDK decreased by 3 points to 95.5 per month, it remained 6% higher year-on-year.The Treasury will conduct direct sales of 2-year fixed coupon bonds with a maturity of 2 years today and 1-year TLREF indexed and 4-year fixed coupon bond auctions with a maturity of 2 years tomorrow. Friday Tuesday will also be the day when the Treasury cash balance, industrial production on Thursday, Market Participants Survey and retail sales volume and turnover indices will be announced.While the new week in global markets started with concerns arising from the regulations on US customs tariffs, Asian stock markets opened with hard selling. There is also a selling trend in the US futures markets. The BIST-100 index ended the last week with a 3% loss in dollar terms, while losses on the US stock markets reached about 10%. This week's data agenda will be relatively calm domestically. 1 Of the banking sector, which will start to be announced at the end of the month. analyst forecasts for the financials of the quarter will also be closely watched. In general, Borsa Istanbul is expected to make a selling start to the new week in parallel with global markets.The Companies with the Highest Market Capitalization in Borsa IstanbulQNB Finansbank (QNBTR) → Market capitalization of TL 1.1 trillion, price per share is TL 324.75, a decrease of 1.29%.Aselsan Electronics Industry (ASELS) → Market value of TL 535.34 billion, price per share is TL 115.40, a decrease of 1.70%.Garanti Bank of Turkey (GARAN) → market value of TL 465.36 billion, price per share is TL 106.30, a decrease of 4.06%.Turkish Airlines (THYAO) → market value of TL 420.56 billion, price per share is TL 300.00, a decrease of 1.56%.Koç Holding (KCHOL) → Market value of TL 407.27 billion, price per share is TL 154.20, a decrease of 3.99%.Precious Metals and Foreign Exchange PricesGold: 3704 TL Silver: 36.74 TL Platinum: 1128 TL Dollar: 38.01 TL Euro: 41.78 TL Hope to meet you again tomorrow with the latest news!
·
7 Apr 2025
OP: Comments and Price Analysis 05.04.2025
Optimism (OP) Technical Analysis: Critical Support TestOptimism (OP) has been on a downward trend for a long time, and this decline has deepened a little due to the negative movements of major cryptocurrencies such as Bitcoin and Ethereum, especially in all financial markets, with the US customs decisions in the last few weeks. However, the level at which the decline finally came, 0.690, is in a region where there is both trend support and liquidation support that remains at the bottom level it did 2 years ago. The picture we see on the charts at the moment shows that it is possible that this region may be bottoming out and we may see upward movements from here.A downward trend line has been prevailing on the chart for quite some time. OP continued to pay homage to this line by making lower peaks with each of his attempts. However, the fact that it has touched both this trend line and the horizontal $ 0.68 – $ 0.69 support area with the recent price movement strengthens the possibility of a pause and a change of direction. These points are the return zones that we often see in technical analysis. Of course, for this turn, it is necessary for the US Stock Markets to turn positive and for the decline on the Bitcoin and Ethereum side to end. OP Trend Theme Support Zones:0.683 – 0.690 $: The current main support - the price is trying to hold on here right now.$0.500 - $0.550: If the support breaks, the strong ground is next.$0.390: ATL level – technically the last line of defense.Resistance Zones:$ 0.943 - $ 1.047: The first recovery zone, strong resistance, but it is possible to overcome.$ 1,404: The level that can be tested in the medium term.$ 1,882 - $ 2,089: The volume zone before the decline began.$2,706: Wide-time potential target.The RSI is currently at 33.19, hovering quite close to the oversold limit, which may indicate that sales are now starting to weaken. While momentum indicators are gradually starting to stabilize, the increase in volume is also attracting attention in recent declines. This may be a sign of a pre-return collection process. This region is important for investors. Because although low levels often seem scary, they offer potential opportunities with the right timing and risk management. If the price takes strength from this support zone and turns its direction up, the December of $ 0.94 – 1.05 will be raised as the first resistance. If it gains upward momentum, technically the $1.40 and $1.88 levels can be targeted. However, if this support is broken, short-term withdrawals may occur. In this case, the use of stop-loss and position control become even more important.As a result, Optimism is trading at the bottom of the long-term downtrend. The level being tested at the moment is a strong support area that has moved the price up many times in the past. If this support works once again, there may be a strong possibility of a short-term recovery for OP. Otherwise, this breakdown may initiate a new wave of decline. Both scenarios are now very close, and once the direction becomes clear, the chances of the move being drastic are quite high. Therefore, patience, confirmation and correct position management are vital in this process.These analyses, which do not offer investment advice, focus on support and resistance levels that are thought to create trading opportunities in the short and medium term according to market conditions. However, the responsibility for making transactions and risk management belongs entirely to the user. In addition, it is strongly recommended to use stop loss in relation to shared transactions.
·
5 Apr 2025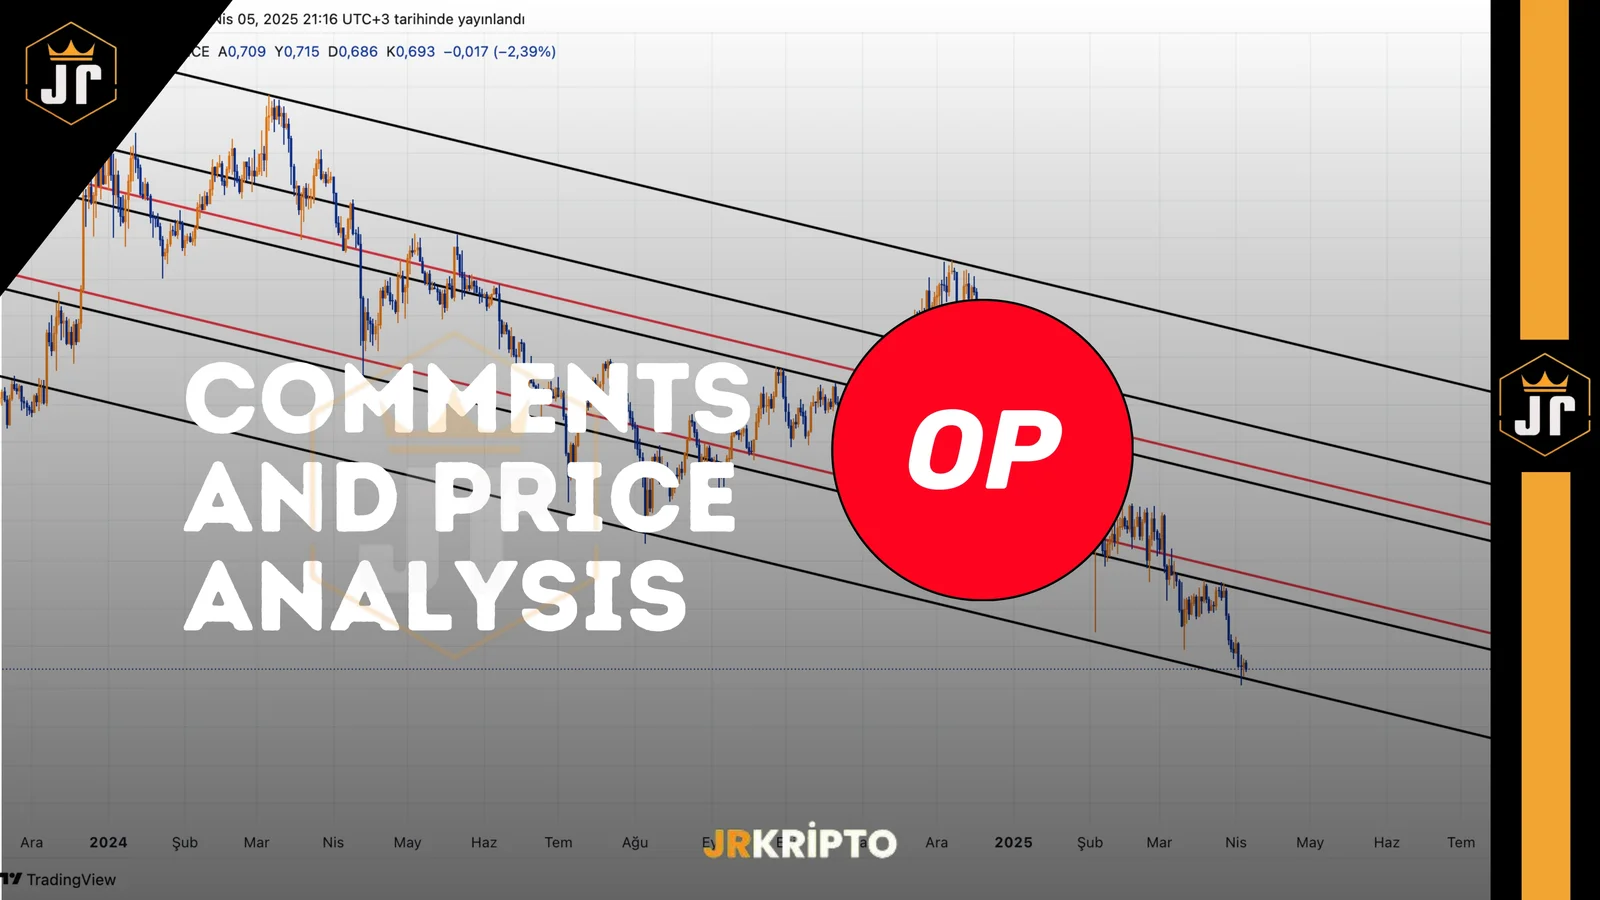
SUI and MIU: Comments and Price Analysis 05.04.2025
SUI (SUI) Technical Outlook: Support - Parametric Operation for Resistance Levels and MIU While SUI continues to be one of the projects that are carefully followed in the market, significant structures have started to form in its technical outlook. In particular, the determined support and resistance levels shape both short-term price movements and investor psychology. The current technical structure can shed light on the direction of not only SUI, but also MIU coin. SUI Medium Term Bullish Expectation $2.1038 – $2.3319: Major Support Area - The Key to Buyer Win This region is a strong support area where buyers take control and SUI finds solid ground. When past movements are examined, it is observed that the price reacts upwards when this level of permanence is achieved. A hold above $2.3319 paves the way for the price to regain momentum. Reaction purchases from these levels have the potential to move the price up by 22% in the medium term. As long as this support line is not broken, the positive scenario for SUI will continue to remain active. $2.54 – $2.8830: Gradual Resistances and the Warming Phase of the Ascent This region represents the resistance line where the price has been challenged in the past, but if it is exceeded, the upward momentum may increase. The levels of $2.54, $2.7637 and $2.8830 should be targeted, respectively. Reaching these levels means that an increase of 22% has been completed. The upward breaking of these resistances and their confirmation by the weekly close breaks the chains in front of the price. This break becomes the beginning of an exciting rise for the SUI investor. $3.6557 – $3.8135: Major Resistance This is no longer just a resistance point; it is a region where the trend structure will change radically, which can trigger a new ATH potential. Reaching this level means that the price will have completed a 60% increase. A permanent breakdown turns the market perception in favor of the bull and triggers the “FOMO” effect in investors. When this area is passed, the market no longer goes into a consolidation, but into a new peak search mode. What Does This Mean For MIU Coin? This strong upward structure of SUI can create a parabolic effect for MIU Coin. The rise of the SUI project increases the interest in ecosystem altcoins. This interest can accelerate the flow of capital directly into its own ecosystem, such as MIU. Now Let's Talk About Mathematics: When projects such as Shiba reach the 7B Market Cap level, MIU has a potential of 712x at today's price. In the past bull cycles, even standard projects easily exceeded the 3D Market Cap threshold. 280X is possible for MIU in this scenario! We know that MIU is in talks with exchanges such as Huobi, Bitmart, Gate io, KuCoin. If 1B Mcap is seen before Binance listing, even this means 95x earnings! Note: These data reflect only the potential. Even if MIU is listed only on central exchanges, it can cause the price to fold. The technical ascension structure in SUI has a signal effect for MIU! If the SUI continues to close above $2.10, the market perception will sharpen in a bullish direction. This will lead to the folding of the capital orientation to projects such as MIU. Given MIU's low market cap, strong community foundation and stock market planning, could SHIBA be the next? it's time to ask your question seriously! These analyses, which do not offer investment advice, focus on support and resistance levels that are thought to create trading opportunities in the short and medium term according to market conditions. However, the responsibility for making transactions and risk management belongs entirely to the user. In addition, it is strongly recommended to use stop loss in relation to shared transactions.
·
5 Apr 2025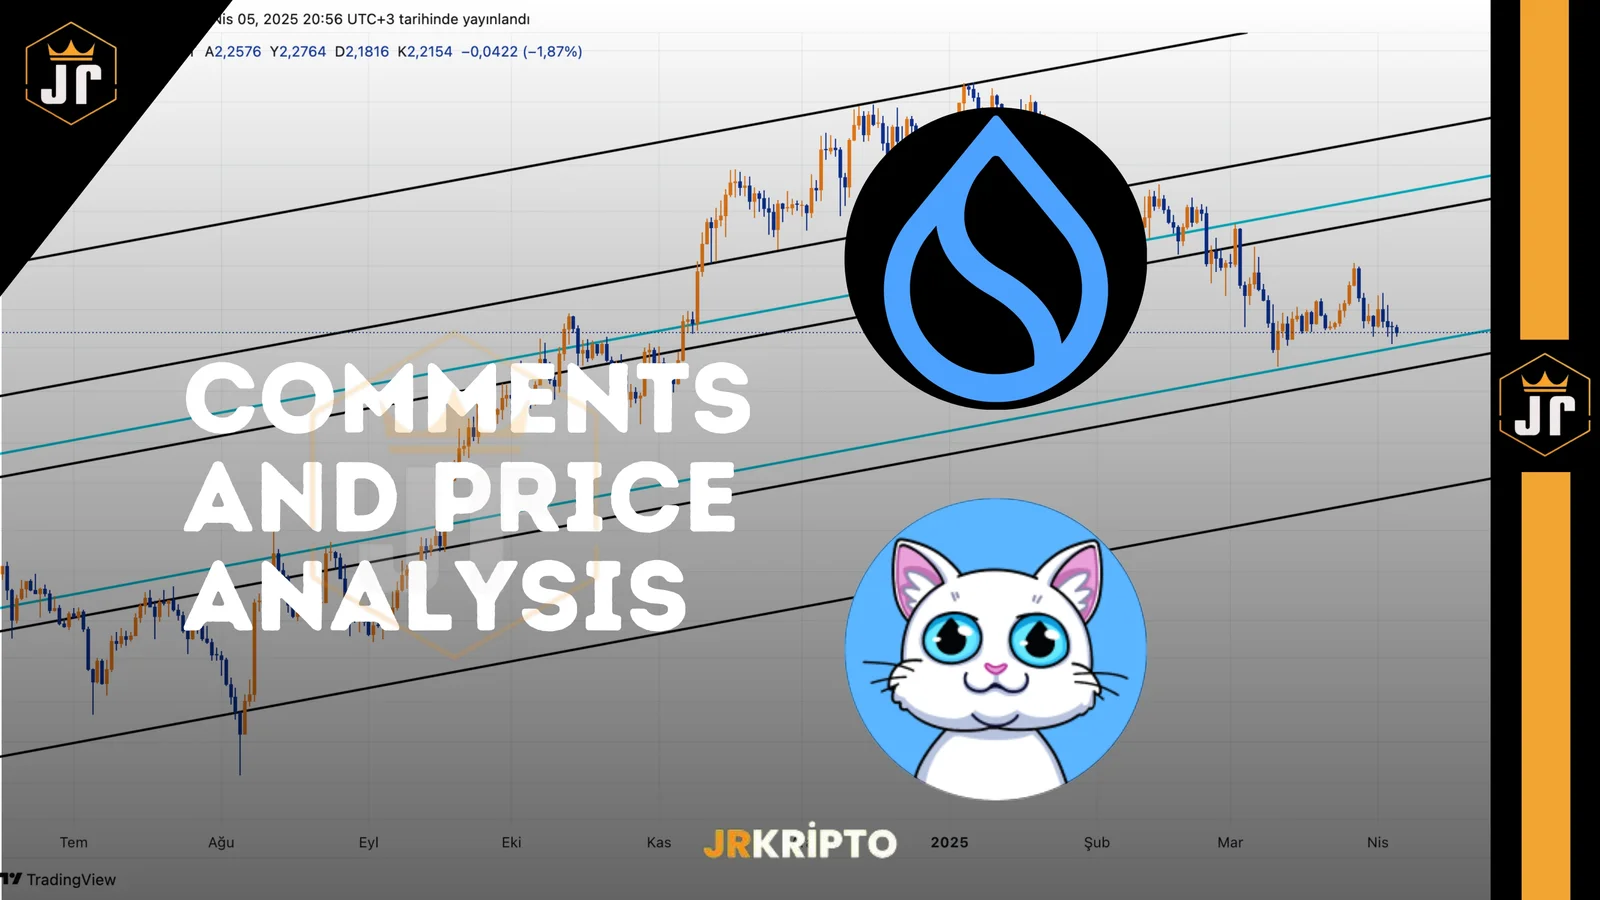
BTC, ETH and USDT.D: Comments and Price Analysis 05.04.2025
In-Depth Analysis of Bitcoin (BTC) and the Crypto Market – Critical Levels and Possible Scenarios The cryptocurrency markets are fluctuating in parallel with the movements of Bitcoin (BTC). It is of great importance to examine the critical levels in order to assess whether the bull season has arrived. Developments in global markets, macroeconomic factors and technical indicators play an important role in determining the future direction of BTC. In this analysis, in addition to the main support and resistance levels of Bitcoin, the USDT Dominance (USDT.D) We will consider in detail the impact of the rate, the total market value and the impact of macroeconomic factors on the BTC price. BTC Demand Zone Bitcoin's Important Support and Resistance Levels Maintaining certain support levels is critical for Bitcoin to maintain its upward movement. At the same time, strong resistance levels need to be overcome for the upward movements to be permanent. Bitcoin Support Levels (Regions where Buyers Are Influential) December 82,300 - $ 83,100: It stands out as a strong support area in the short term. This region is located among the levels where buyers are active and their interest is concentrated. Dec. $80,691 Level: The main support level where Bitcoin shows strong buying reactions. If the price remains above this level, the upward trend can be expected to continue. Macro Support Level of $73,336: This region is a critical turning point in Bitcoin's ascent, which started at the $15,500 level. Previously, BTC had experienced an increase of more than 150% after this level. If the price falls back here, it is likely that a strong buying movement will begin. If the $80,691 level is lost, the $73,336 zone can be tested. Bitcoin Resistance Levels (Regions where Sellers are Strong) $87,500 Level: An important resistance zone for Bitcoin. This level, which acted as support in the past, has now become one of the main resistance points faced by the price. If BTC exceeds this level, it can gain bullish momentum. $92,591 Level: Another of the key resistance levels that will determine the price direction of BTC. If there is a permanent movement above this level, BTC could move towards the December range of $95,745 - $97,213. $95,745 - $97,213 (NPOC) Region: This region stands out as an area that has attracted attention with high trading volumes in the past and where market balance has not been achieved. If BTC passes this level, the probability increases that the price will quickly move towards $ 110,000. $ 110,000 Main Goal: When Bitcoin reaches this level, new peaks may be opened. From a technical point of view, it can be expected that the upward movement will accelerate when the price discovery process is entered. A break of the $87,500 level further strengthens the bullish trend for Bitcoin, while the $110,000 target becomes a closer possibility if it holds above $95,745. The Impact of Macroeconomic Factors on Bitcoin The price of Bitcoin depends not only on technical levels, but also on global economic developments, US Central Bank (FED) policies, inflation rates and political events. April 2 Trump Customs Tariffs Statement: The new tariffs imposed by the United States have led to additional taxes being imposed on many countries. Oct. This situation has created a risky environment by creating uncertainty for the markets. FED Rate Decisions and Bitcoin: If the FED signals an interest rate cut in May, this could be a positive development for Bitcoin. The low interest rate environment provides more liquidity to the market and increases interest in risky assets such as BTC. The future movement of Bitcoin's price will depend not only on technical levels, but also on macroeconomic developments. Therefore, it is important for investors to carefully monitor both factors. Ethereum (ETH): Price Map, Critical Levels and Direction-Determining Regions Ethereum is trading at price levels that play a key role in determining the direction of the market. In the current situation, the regions where both buyers and sellers are concentrated are clearly separated. This separation allows us to read the short- and medium-term roadmap of ETH more clearly. Below, we have discussed in detail the main support, resistance and conversion levels that will shape Ethereum's ascension scenario. ETH Major Demand Level $1572 – $1690: Deep Demand Area and the Basis of the Rise This region is the main support line for Ethereum, where there is strong buyer interest. When historical data are examined, it is noteworthy that while hard sales come when these levels are below; strong reaction purchases are seen when they stay above. Persistence above the $1690 level ensures that the bullish potential for ETH remains alive. If it goes below $1572, it comes across as a corporate safe zone This region serves as the basic base that forms the basis for Ethereum to establish a healthy ascension structure. 1960$ – 2069$: SR Flip Area – The Heart of the Direction Selection This is not only a resistance zone, but also a strategic decision point that will determine the direction of the price. The term SR Flip (Support to Resistance Flip) refers to the testing of an area that previously worked as support in technical analysis as resistance after going below the price. In the case of Ethereum, this region provided strong support in the past, but now we see that the same region serves as a resistance. Why is this area so important? The $1960 - $2069 region is an area where investor psychology has been broken and retested. If ETH breaks this level up with a high trading volume and provides permanence here, this is interpreted as a “confirmed trend turn” in technical terms. This breakdown can lead to the start of new waves of purchases by instilling confidence in investors. However, a rejection in this region will bring up the ”false breakout" scenario and push the price back to support levels. In this respect, the SR flip area is not only a technical dam; it is also a litmus test on which we can measure market sentiment. The price behavior to be seen here may determine the short-term fate of Ethereum. $2533 – $2722: High Time Zone Resistance and Trend Formation Zone These levels are strong resistance points that Ethereum faces in higher time periods (for example, on weekly charts). This region is known as the area where the price has previously turned down, slowed down volumetrically and profit realizations have increased. If ETH can pass these levels in volume, a new trend structure will be formed in the medium term. However, if the selling pressure increases here, the market may enter into a consolidation process for some time. This resistance band may be the trigger for the second stage of the ascent. $3,400 and $5,000: The Route of the Big Players and the Layer 2 Effect These two levels, which are among the long-term goals of Ethereum, are in the focus of institutional investors. Dec. In particular, the $3,400 level stands out as an area where liquidity has been concentrated in the past and large orders have been collected. If persistence above $3,400 is achieved, the $5,000 target comes to the table by entering the price discovery area. The fact that ETH crosses such psychological thresholds activates not only itself, but also ecosystem projects. Especially Layer 2 projects (such as OP, ZKSYNC, ARB, STRK) may be positively affected by this increase and may see a serious flow of funds. USDT Dominance (USDT.D): Market Confidence, Fund Flow and Critical Turning Points One of the most effective ways to understand investor behavior in the cryptocurrency market is USDT Dominance (USDT.D) to analyze the graph. This metric shows whether investors are using their capital in favor of risky assets or safe havens. USDT.When D rises, investors run away from risk by turning to stablecoins, while when it falls, capital flows back into crypto assets. Therefore, it is USDT to understand the direction in BTC and altcoins.D levels play a critical role. USDT.D Below we have detailed the effects on the market according to the current technical levels: 5.52% - Decision Moment: Buyer Pressure Is Building, But It Must Be Broken For the Sale To Be Completed This level indicates that the panic mood in the market is gradually ending, but investors are still cautious. USDT.The fact that D has reached this level indicates that sales in cryptocurrencies have slowed down, but confidence has not fully returned. If USDT.If D starts making closures below this level, we can say that the selling pressure has decreased and the flow of funds to cryptocurrencies may start again. However, a persistence above 5.52% indicates that investors are still maintaining their stablecoin positions and the market is having a difficult time recovering. This level is a region where the market is approaching the neutral position; a clear bullish signal is not received unless there is a downward break. 5.32% - Breaking Threshold: May Initiate Retreat, Descent Below Triggers Rise the level of 5.32%, USDT.It stands out as the “critical decision zone” of D. The downward break of this area indicates that investors are quickly leaving their stablecoin positions and re-entering cryptocurrencies. If the 5.32% downside breaks, the market will breathe a sigh of relief and sudden rises in BTC and altcoins may be seen along with an increase in volatility. This breakdown is also the clearest sign that investor confidence is returning. This area is the front door of the bull scenario. Strong reception waves can be triggered after this point. 5.03% - The Region Dominated by Sellers: It Should be Carefully Monitored Although the decline of USDT Dominance to the 5.03% level indicates that the market's appetite for buying is increasing, this region should be followed carefully as it is also a potential bottoming region. It is observed that sales are intensifying at this level and investors are aggressively switching to risky assets. However, a support that may occur here may temporarily end the selling wave and USDT.D may start to rise again. A clear break of this level opens up the possibility of a strong rally in Ethereum and altcoins. However, the jumps that can be experienced from here can also prepare the ground for sudden snow realizations. Strategic Foresight going below 5.52%: Risk appetite is increasing in the market, the bullish scenario is strengthening.
·
5 Apr 2025
ZRO: Comments and Price Analysis 05.04.2025
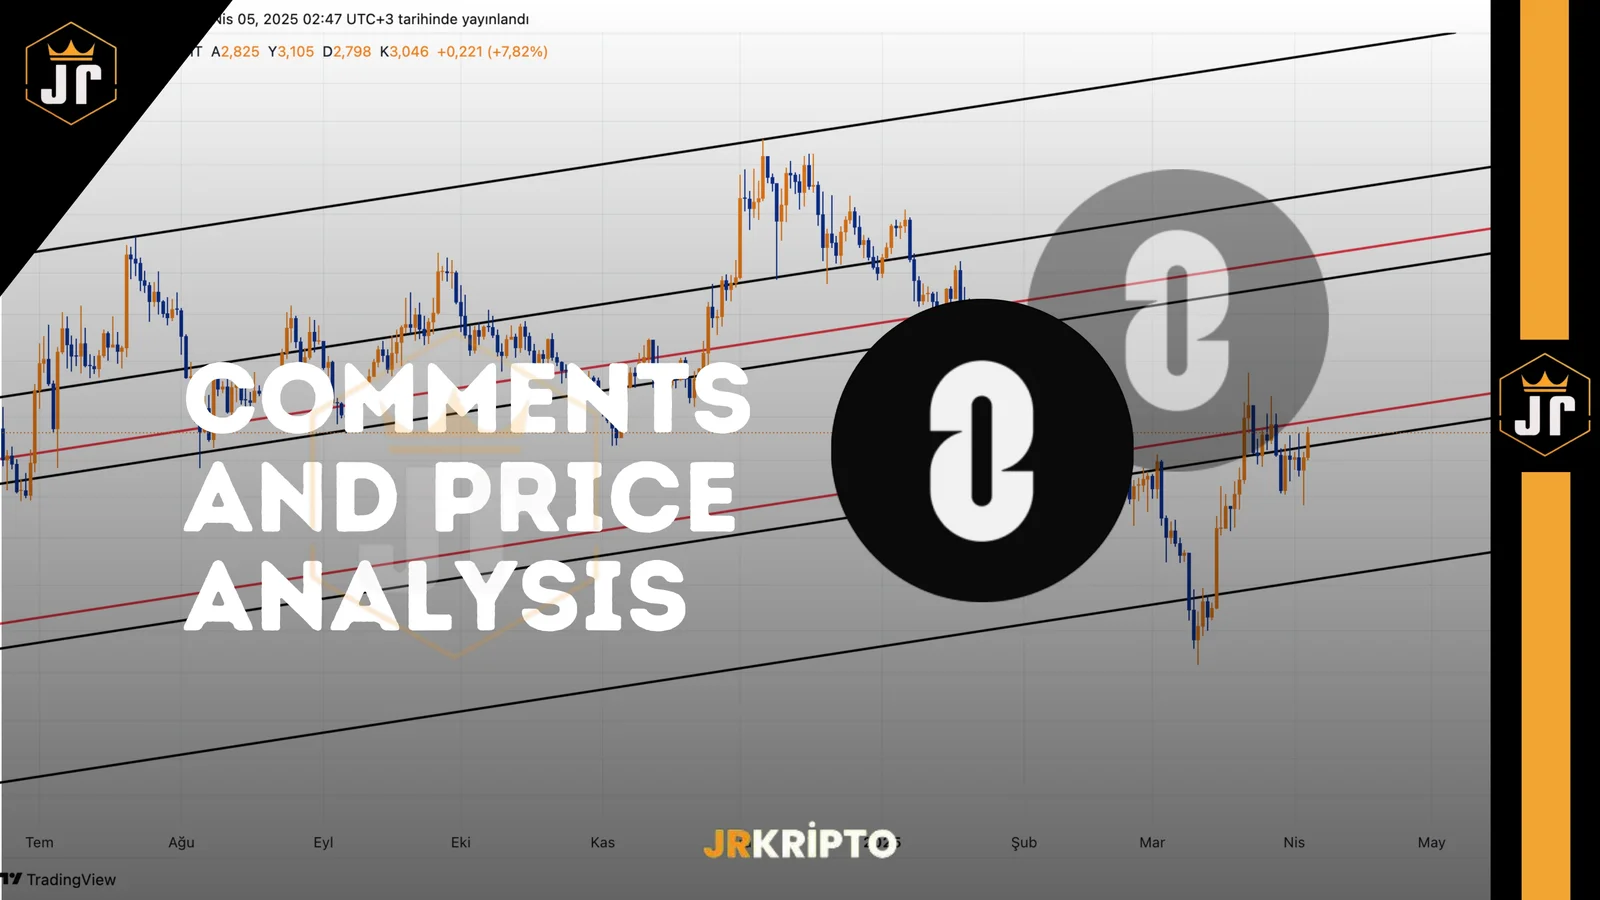
ZRO Technical Analysis: Downtrend Broken, Now It's Time for Resistance LevelsZRO has experienced a sharp decline in recent weeks. However, this drop may not only signify weakness but also lay the groundwork for a potential trend reversal. The most crucial recent development on the chart is that the downtrend has been broken. This shift suggests that the downward pressure could be replaced by a more neutral or even upward trajectory.Currently, the price is around 3.032 dollars, a critical technical and psychological threshold. Below this level, the 2.54 – 2.39 dollar range stands out as a key support zone where the broken trend has been retested. This is a classic support-resistance flip. ZRO Falling Trend Breakage Support Levels:2.54 – 2.39$ : Retest zone after the trend break – the first area to watch for a reaction2.074$ : Major support – previous bottom of the downtrend1.65 – 1.50$ : Liquidity zone where buyers are concentratedResistance Levels:3.005$ : Short-term key resistance – price is currently testing this level3.54 – 3.76$ : Strong mid-term resistance zone – first target after a breakout above 3.00$4.52$ : Major resistance in the long term – the origin of the previous downtrendThe price is now testing the 3.00 dollar resistance. If a daily close occurs above this level, the price could technically rise towards the 3.76 dollar region.The descending red trendline on the chart was the primary barrier that had been pressuring the price for weeks. Its upward breakout signals a potential shift in market structure. The key question now is whether this breakout will hold. The most important factor is whether the price can maintain support levels after the breakout. So far, this test seems successful.ZRO is not just searching for direction; it appears to have already chosen one. The broken downtrend has now given way to a structure where Fibonacci resistance levels are being tested.A confirmed daily close above 3.00 dollars would be the first sign of continued upside movement. If this level is surpassed, targets like 3.76 and 4.52 dollars could come into play. However, if the price falls back below 2.54 dollars, the breakout may be invalidated, leading to renewed downward pressure.In conclusion, it seems that ZRO has finally left its long-standing downtrend behind. The current market structure resembles a classic reversal scenario, where horizontal resistances are being tested after a trend change. However, for this reversal to be sustained, stability above 3.00 dollars is essential. From a technical perspective, this possibility appears to be gaining strength.Disclaimer:This analysis does not constitute investment advice. It focuses on support and resistance levels that may present potential short- to mid-term trading opportunities depending on market conditions. However, all responsibility for trading decisions and risk management lies entirely with the user. The use of stop-loss orders is strongly recommended for any trade setup shared.
·
4 Apr 2025